
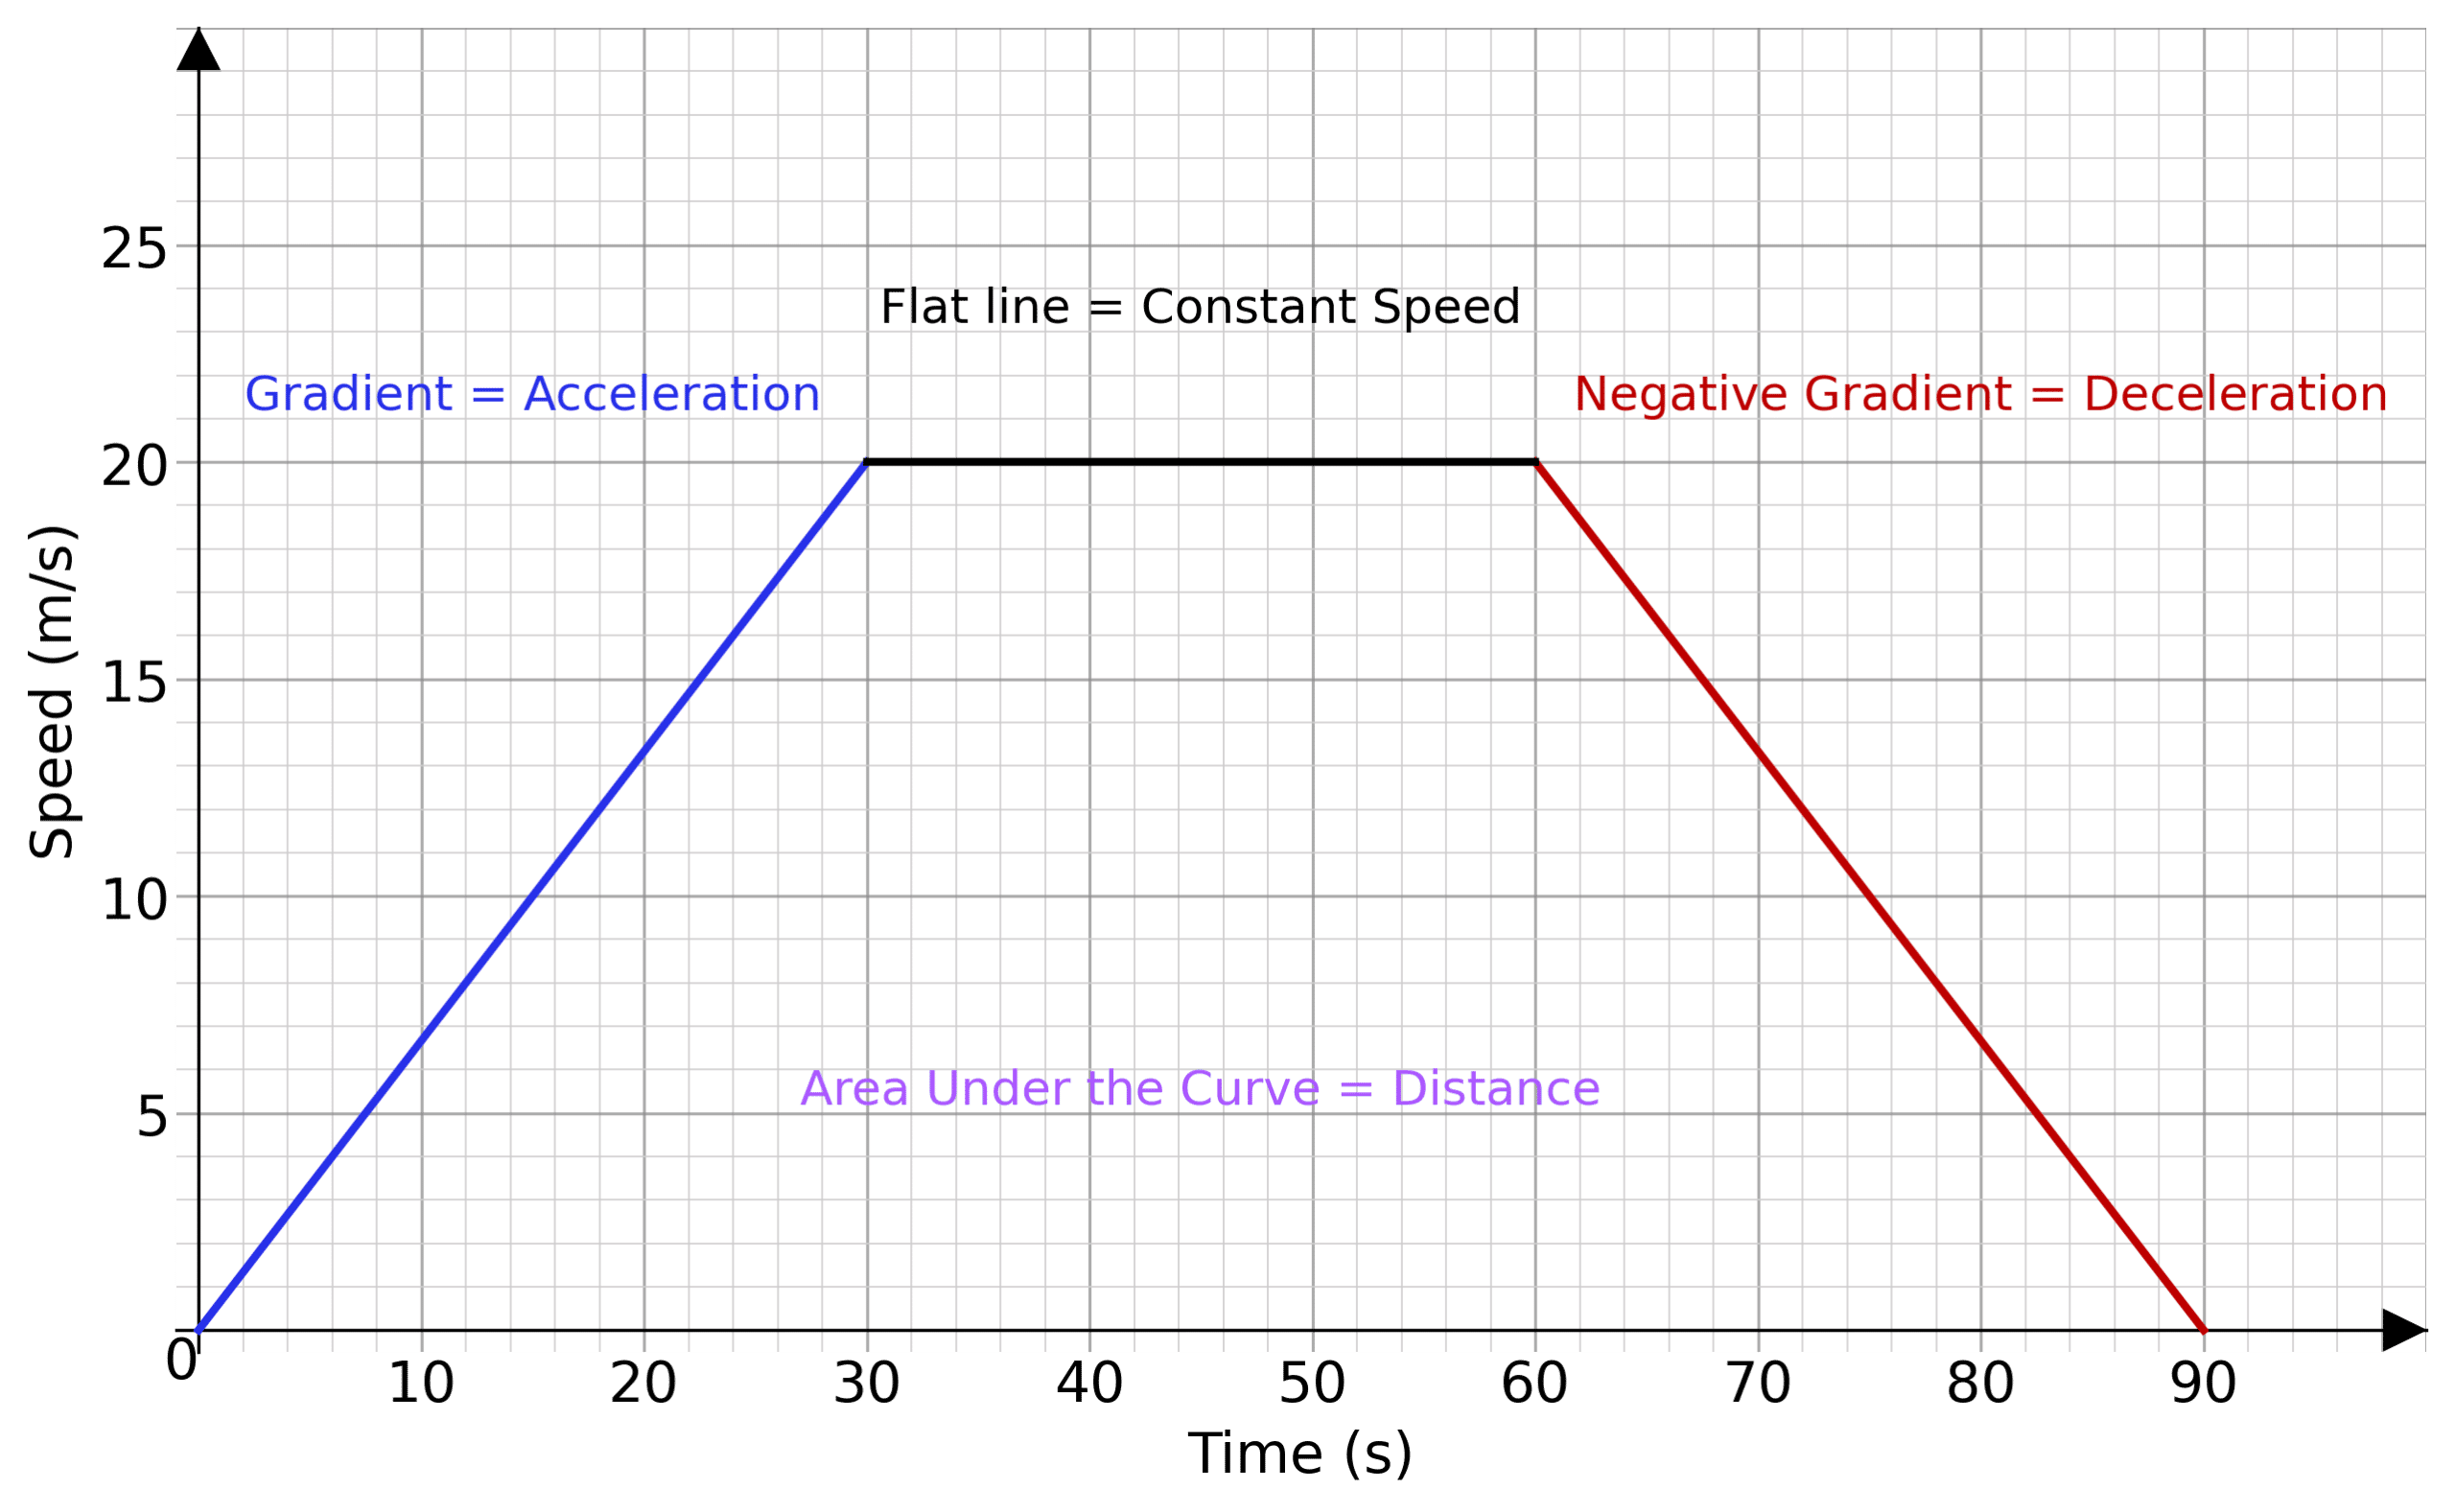
Speed-time graphs (or velocity-time graphs) graph an object’s movement over time.
Time is plotted along the x -axis and is measured in a unit of time, usually seconds.
Speed is plotted along the y -axis and is usually measured in meters per second ( \text / \text or \text^ )
A unique feature about speed-time graphs is how much information we can attain from them
We may discern from a speed time graph a lot of information about the movement of the object.
The gradient of the graph is the objects acceleration .
A negative gradient means an object is decelerating .
A flat line means the object is moving with a constant speed .
The area under the curve is the distance the object has travelled.

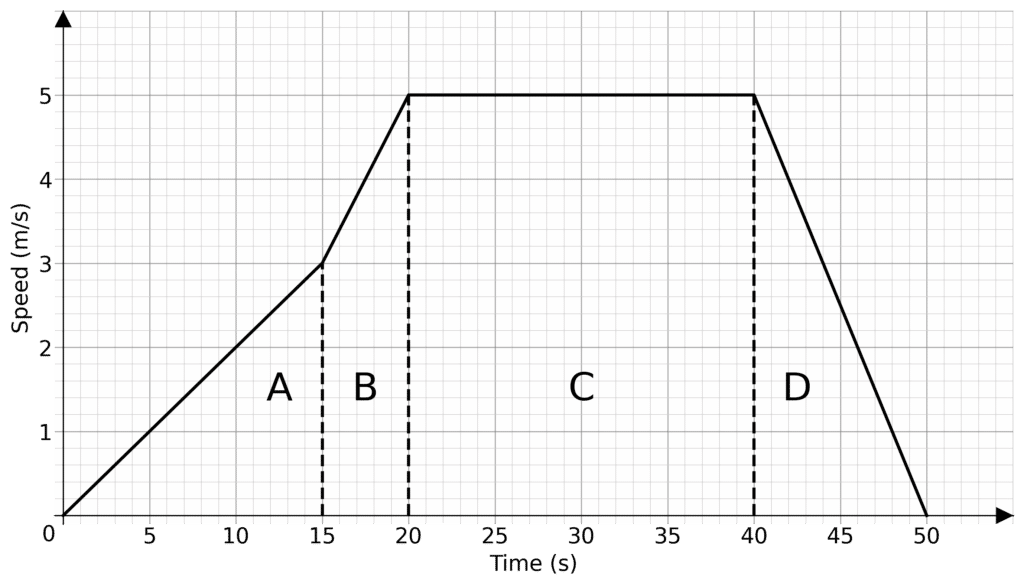
We need to be able to describe the speed-time graph. One way to fully describe a speed-time graph is to break up the journey into parts .
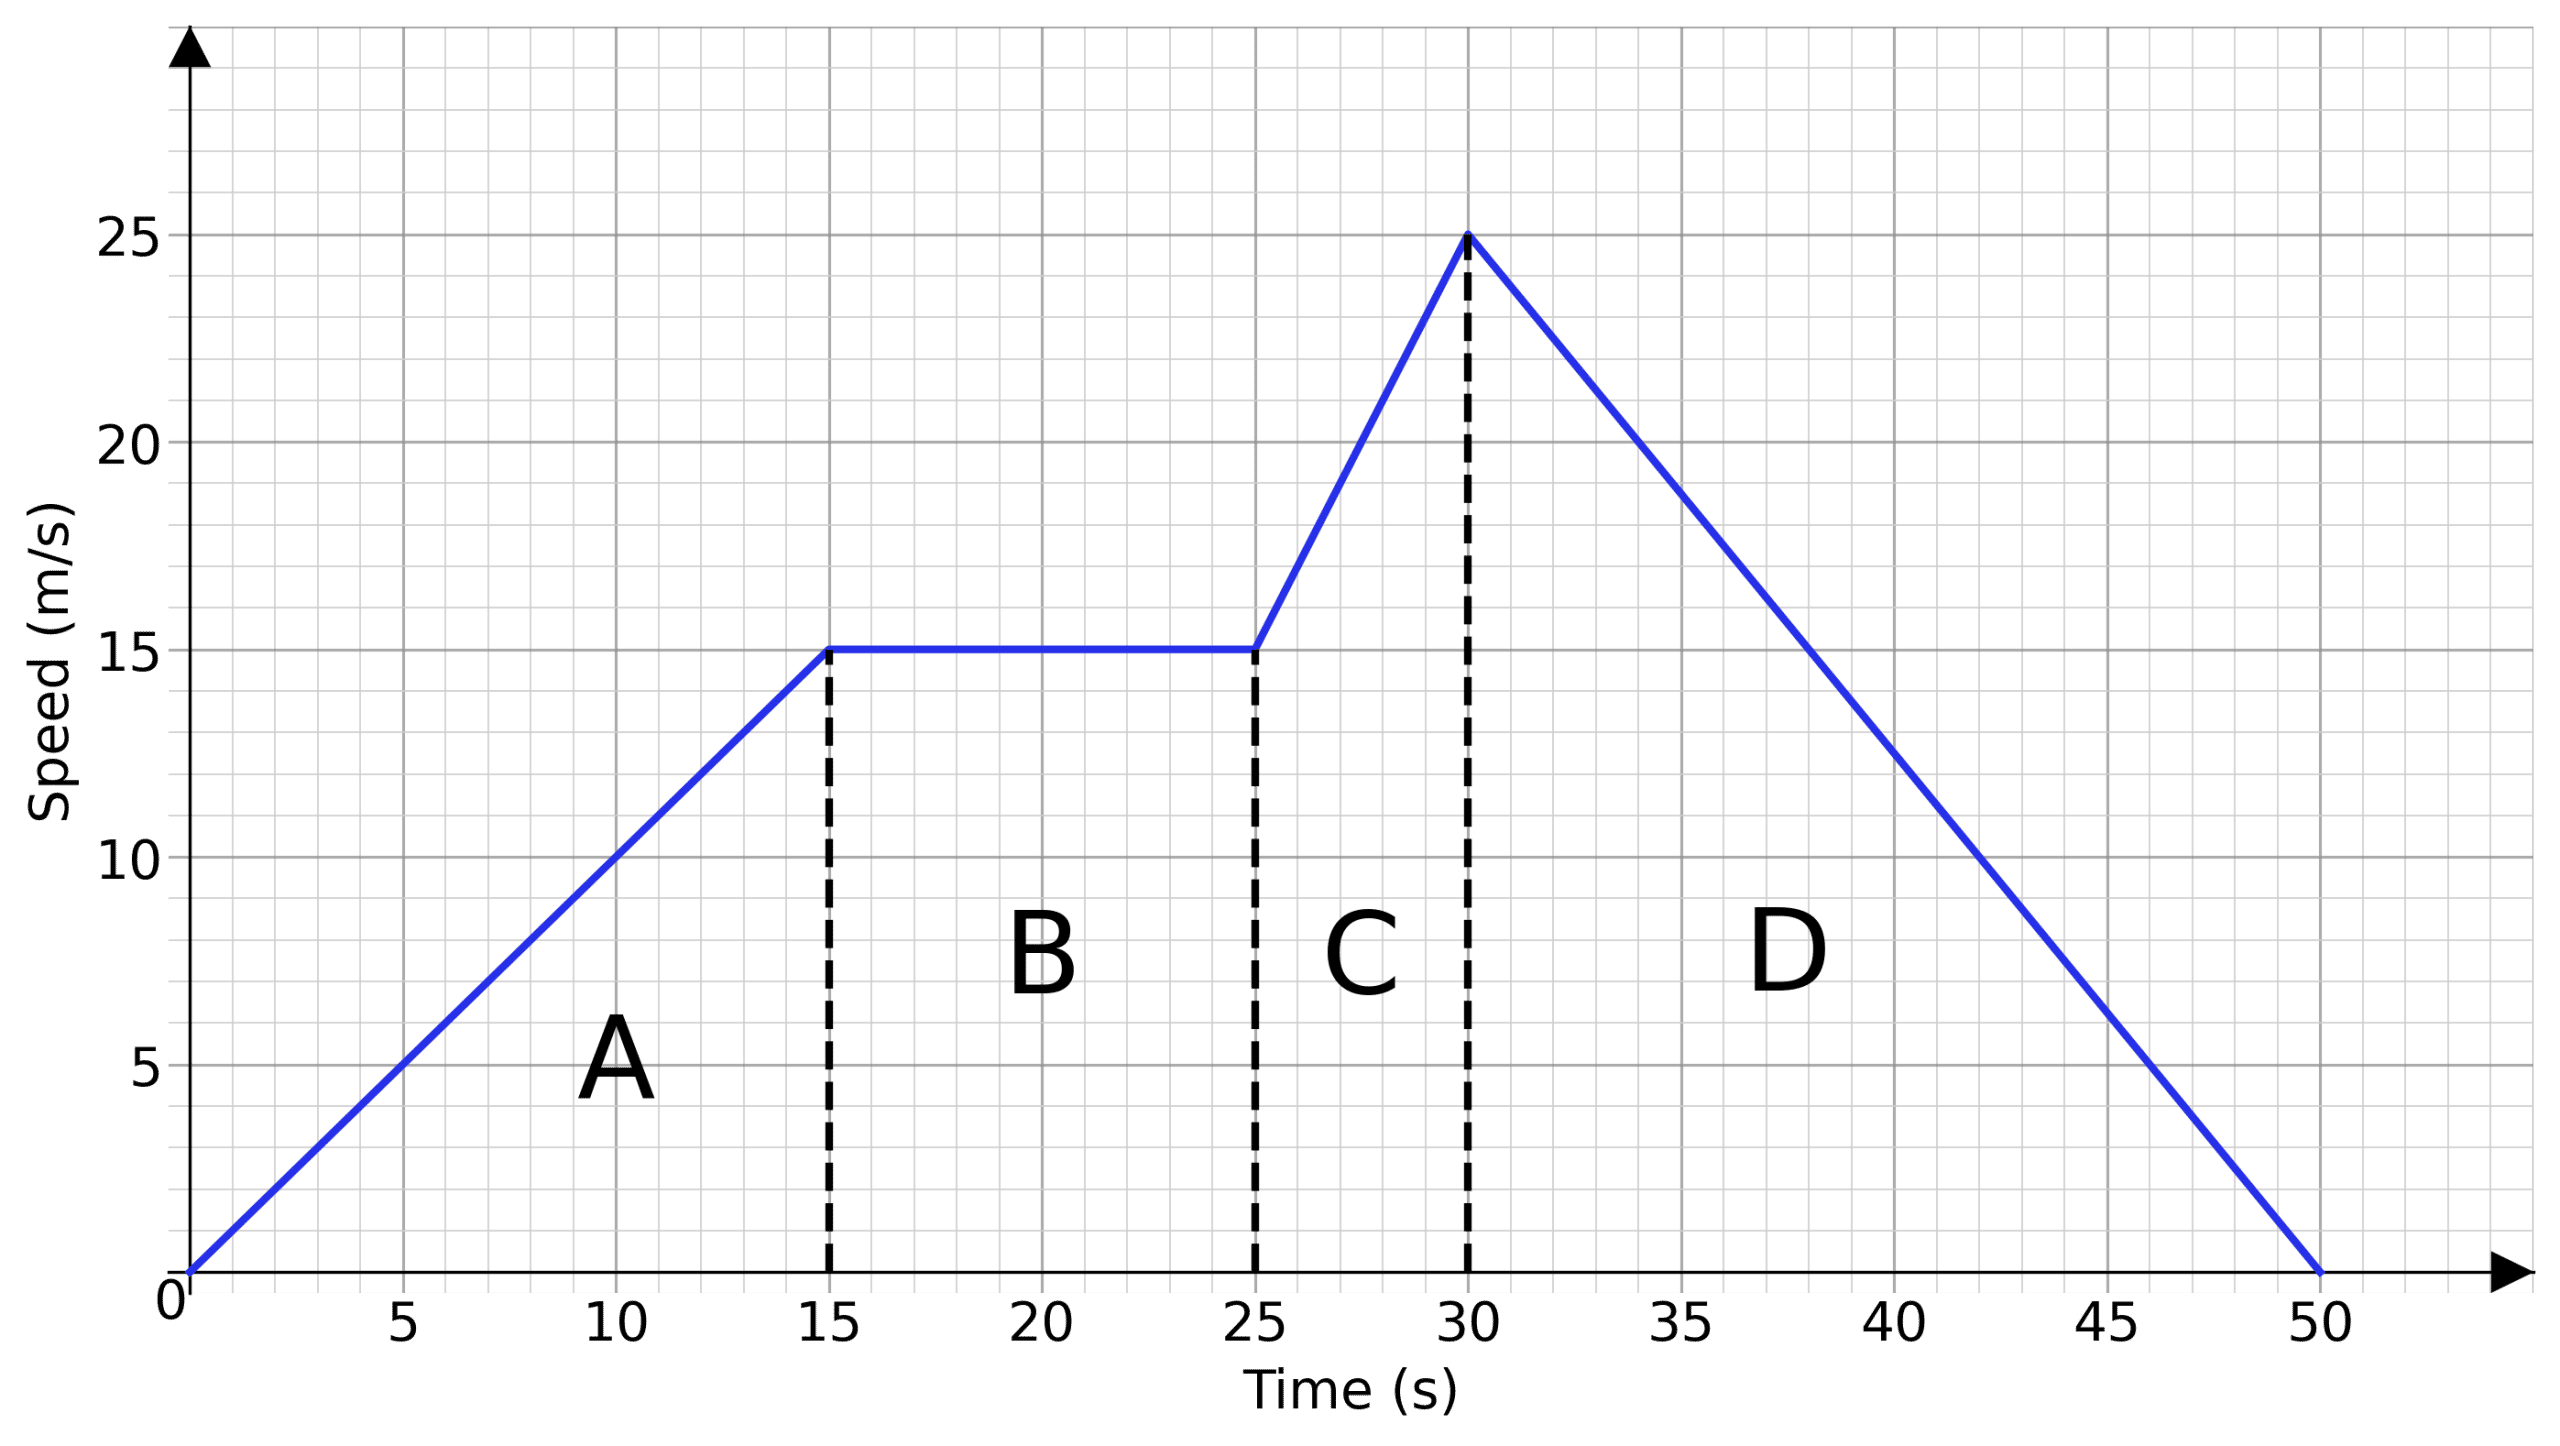
Here the graph has been broken up into four sections. A , B , C and D . Describing them individually is easier than describing the graph in one go. In this example
A : The object accelerates from 0 \text< ms>^ to 15 \text< ms>^ over 15 seconds.
B : Then the object travels at a constant speed of 15\text< ms>^ for 10 seconds.
C : The object then accelerates again from 15\text< ms>^ to 25\text< ms>^ in 5 seconds.
D : The object then decelerates from 25\text< ms>^ to stationary in 20 seconds.
Level 4-5 GCSE Edexcel iGCSE 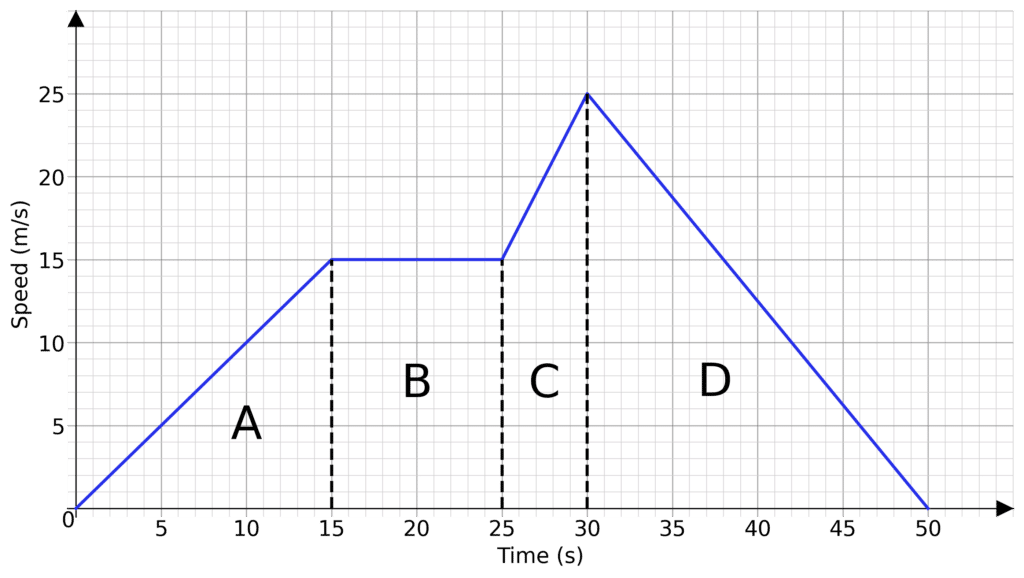
Using the previous example, we shall still divide the graph and find the gradient for each section.
given that we can find the acceleration, which is measured in meters per second ^ or \text^ .
A : The gradient is then the difference in speed divided by the difference in time, which here gives us
B : Here the graph is flat, so it has no acceleration.
C : The acceleration here is
D : The acceleration here is
Negative acceleration is deceleration, so here we can say instead that it decelerates at a rate of 1.25 \text< ms>^1.25 ms−2
Level 4-5 GCSE Edexcel iGCSE
Using the previous example, once again it makes sense to divide the graph into sections. Here the area between the line and the x -axis forms a few easier to calculate shapes.
Section A is a triangle, B a rectangle, C a trapezium and D is another triangle. We know the height and with of all these sections, so the total distance travelled is just the sum of their areas.
\textbf= \dfrac \times 15 \times 15 = 112.5
\textbf= 15 \times 10 = 150
\textbf= \dfrac \times 5 = 100
\textbf= \dfrac \times 25 \times 20 = 250
So the total distance travelled is the sum of these areas
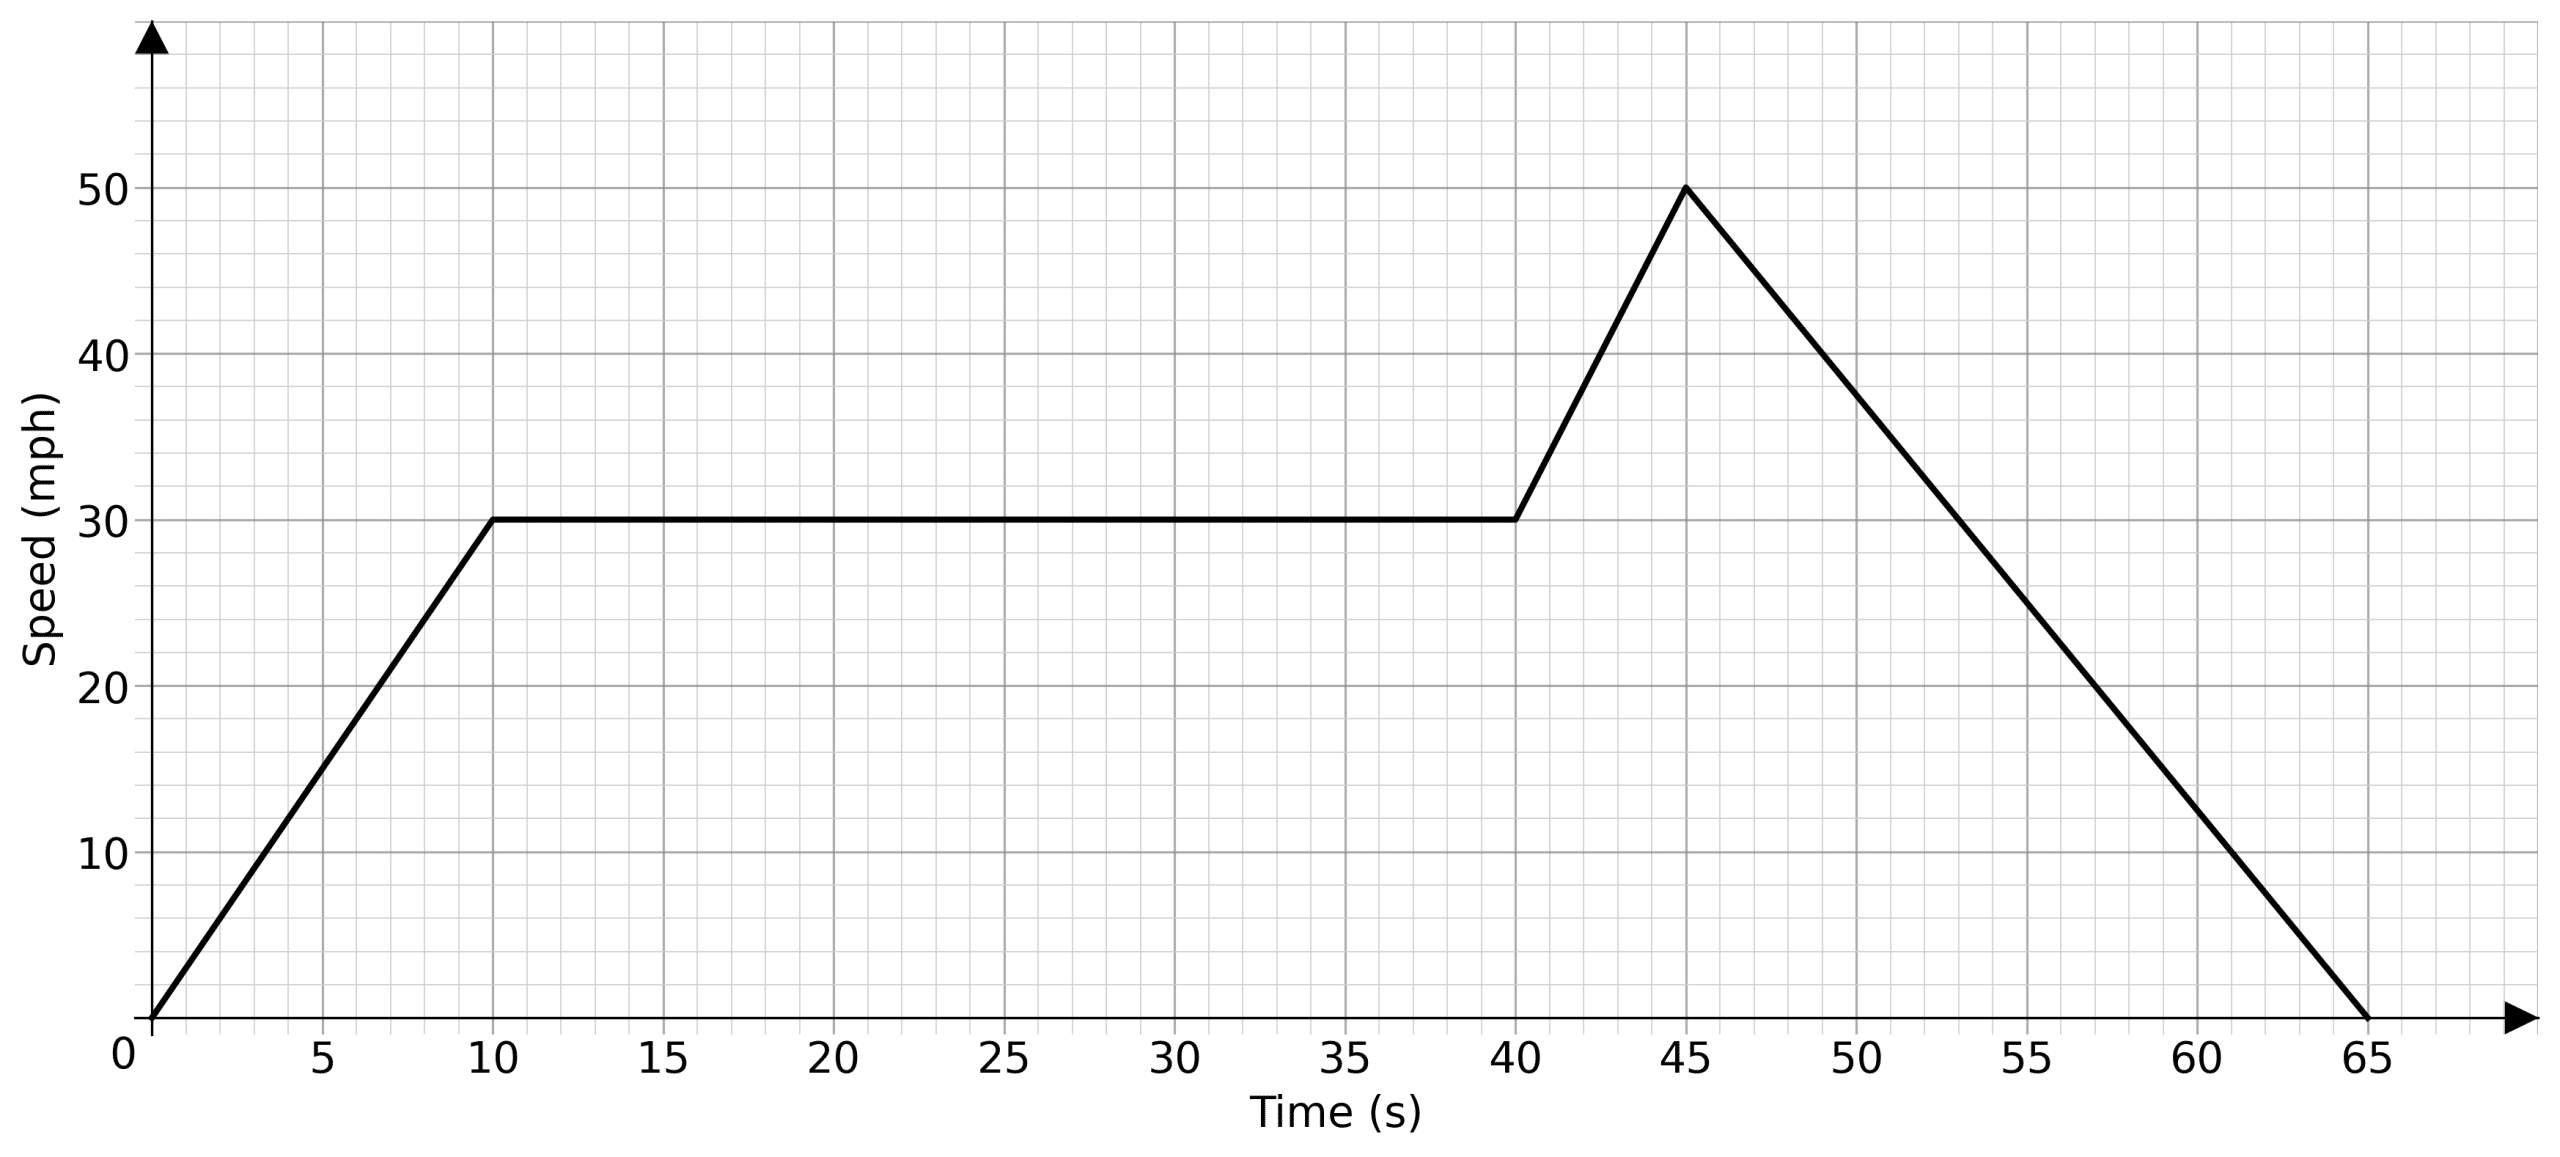
Level 4-5 GCSE Edexcel iGCSEA car journey begins with the car stationary. It then accelerates at a constant rate to 30 \text in 10 seconds. It then travels at a constant speed for 30 seconds, then speeds up linearly to 50\text in 5 seconds only to decelerate for 20 seconds until it comes to a stop.
Draw this speed-time graph.
[4 marks]
We shall break this journey up into four sections.
Firstly, the car starts at 0 \text < mph>at 0 seconds, then the car accelerates for 10 seconds until it is at 30 \text , so there is straight line from (0,0) to (10, 30) .
Next, the car travels at a constant speed of 30\text for 30 seconds, which gives us a flat line from (10,30) to (40, 30) .
Then the car accelerates for 5 seconds until it is at 50 \text . For this we draw a straight line from (40,30) to (45,50) .
Finally the car decelerates for 20 seconds until it is stationary. We then draw a line from (45,50) to (65, 0)
This gives us a speed-time graph of
Question 1: For the following speed-time graph
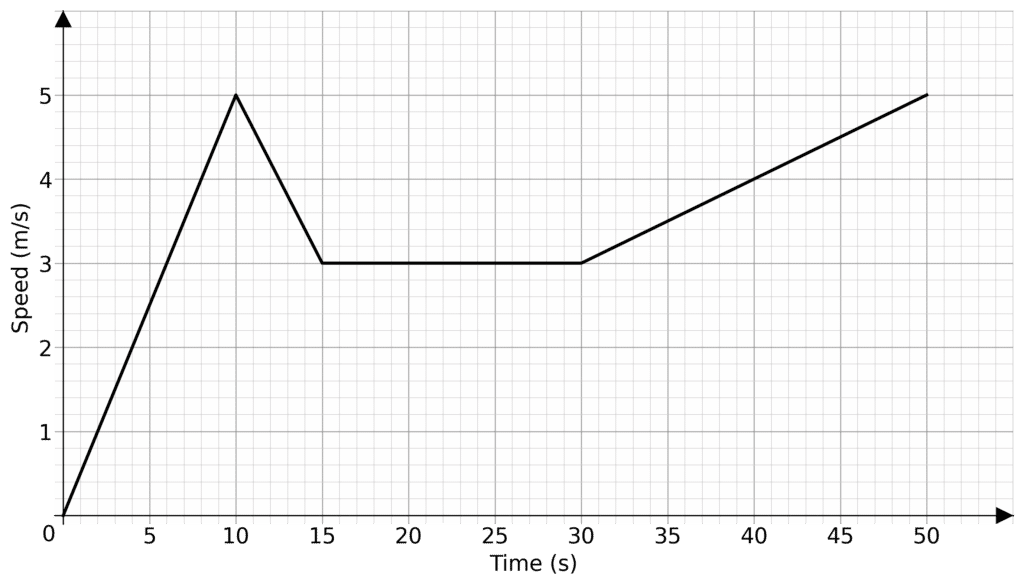
a) The total distance travelled
[3 marks]
b) The acceleration between 0 and 10 seconds
[2 marks]
Level 4-5 GCSE Edexcel iGCSEa) The total distance travelled is the area under the graph. It will then be easier to break the graph into sections with easy to work out sections.
Here, sections A is a triangle, B and D are trapeziums and C is a rectangle.
\textA = \dfrac\times 10 \times 5 = 25
\textB = \dfrac\times 5 = 20
\textC = 15 \times 3 = 45
\textD = \dfrac\times 20 = 80
So the total area is
So the distance travelled is 170 \text
b) The acceleration is the gradient. Between 0 and 10 seconds it has a constant constant gradient as it is a straight line. So using the points (0,0) and (10,5) we get a gradient of
So the acceleration is 0.5 \text< ms>^

Save your answers with
Gold Standard Education
Show Answer Still marking manually? Save your answers withFind out more
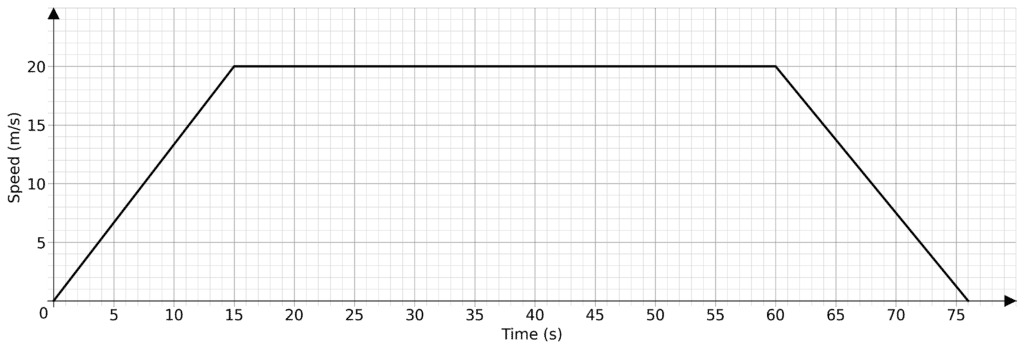
Question 2: A metro train has a short journey. As it departs from the station and accelerates at a constant rate for 15 seconds until is reaches a speed of 20 \text < m/s>then it travels at a constant speed for 45 seconds. It then decelerates at a rate of 1.25 \text< ms>^ until it comes to a halt.
Draw a speed-time graph for the train’s journey.
[4 marks]
Level 4-5 GCSE Edexcel iGCSEWe begin the journey at 0 seconds and 0 \text < m/s>. We can then draw a straight line from (0,0) to (15, 20) as the train accelerates. Then we may draw a flat line from (15,20) to (60, 20) as the train travels at a constant speed.
We need to work out how long the train takes to come to a stop. If it was increasing in speed at 1.25 \text< ms>^ to 20\text < m/s>we would have
t = \dfrac = 16 \text
Therefor it would take 16 seconds for the train to decelerate from 20\text < m/s>to 0\text < m/s>at the same rate.
So we may draw a straight line from (60, 20) to (76, 0) , giving us a graph
Save your answers with
Gold Standard Education
Show Answer Still marking manually? Save your answers withFind out more
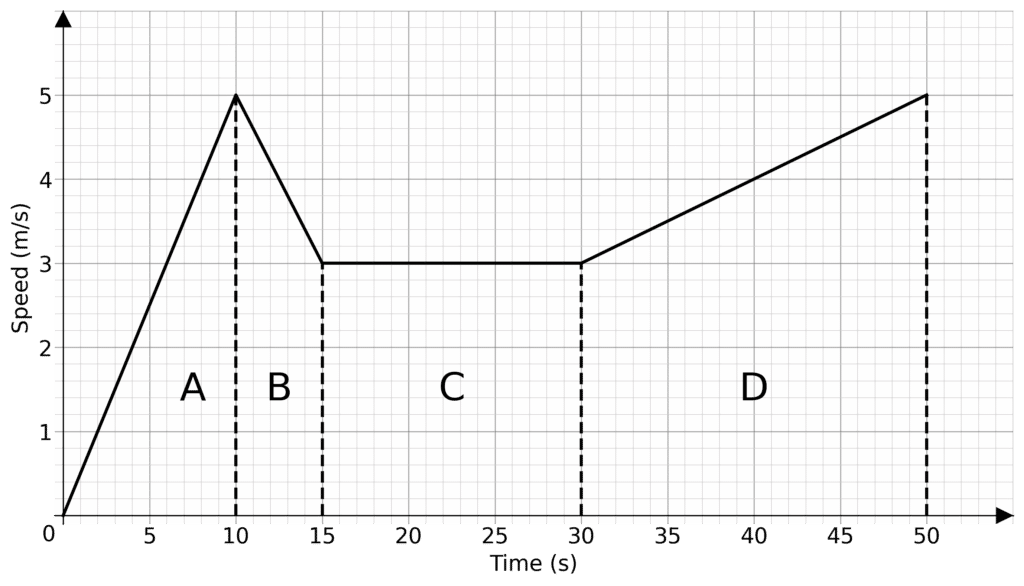
Question 3: A journey is broken up into four sections as shown
a) Describe the acceleration for each section of the journey.
[3 marks]
b) Find the total distance travelled.
[3 marks]
Level 4-5 GCSE Edexcel iGCSEa) For section A: The acceleration is the gradient. Given points (0,0) and (15, 3)
Acceleration is 0.2 \text< ms>^2
For section B: The acceleration is the gradient. Given points (15,3) and (20, 5)
Acceleration is 0.4 \text< ms>^2
For section C: As this is a flat line the acceleration is 0 \text< ms>^2
For section D: The acceleration is the gradient. Given points (40,5) and (50, 0)
The deceleration is 0.5 \text< ms>^2
b) The total distance travelled is the area under the graph.
\textA = \dfrac\times 15 \times 2 = 22.5
\textB = \dfrac\times 5 = 20
\textC = 20 \times 5 = 100
\textD = \dfrac\times 5 \times 10 = 25
So the total area is
So the distance travelled is 167.5 \text
Save your answers with
Gold Standard Education